
Problem Space & Design Goals
In modern web applications, data visualisation is a critical component that requires flexibility, maintainability, and extensibility. When building a charting system, supporting multiple chart types across heterogeneous rendering requirements quickly becomes an architectural challenge.
In our case, the system needed to support 15+ chart types that users could dynamically add to dashboards. Each chart could be powered by different charting libraries, and although the API responses were consistent, each library expected the input data in its own specific format. What initially seemed like a UI concern soon revealed itself to be a deeper issue involving data transformation, extensibility, and long-term maintainability.
This post, focuses on the challenges we faced and explains the architectural direction we chose. In the next posts we’ll see how we addressed them with a small set of design patterns.
Technical Context
Our Analytics product is built using Angular as the primary frontend framework. For visualisation, we support multiple libraries depending on the widget type, including AG Grid for tabular data and Highcharts for basic chart-based visualisations, along with a few custom-rendered charts.
While the API responses remain consistent, each library imposes its own expectations on how data should be structured. This divergence in data contracts across libraries became a central factor in shaping the overall architecture.
The Core Mismatch: Same Data, Different Library
Expectations
One of the key challenges was that different visualisation components required the same dataset to be shaped differently.
For example, consider a dataset fetched from a consistent API:
[
{"device": "android", "views": 12,000},
{ "device": "iphone", "views": 15,000 }
]
A data-grid widget powered by ag-Grid expects a flat row-based structure:
rowData = [
{"device": "android", "views": 12,000},
{ "device": "iphone", "views": 15,000 }
];
However, a bar chart rendered using Highcharts expects a categorized structure:
series = [{
name: "views",
data: [12000, 15000]
}];
categories = ["android", "iphone"];
The underlying API data remains consistent, but each library requires a distinct transformation. As the number of supported chart types and libraries grows, this transformation layer becomes a central architectural concern rather than a simple formatting step.
Why Naive Approaches Break Down
A typical early implementation often resembles this:
switch (chartType) {
case 'bar': return transformToHighchartsBar(data);
case 'grid': return transformToAgGridRows(data);
case 'line': return transformToHighchartsLine(data);
}
In practice, this switch statement and the corresponding transformation logic lived inside a single class responsible for orchestrating chart rendering. Over time, this class accumulated multiple responsibilities:
Deciding which chart type to render
Transforming raw API data
Handling library-specific formatting
This violated the Single Responsibility Principle and tightly coupled transformation logic with rendering decisions. Every new chart type or library variation requires modifying existing logic, violating the Open/Closed Principle and increasing the risk of regressions.
Core Challenges
1. Data Transformation Complexity
Although the API responses are consistent, each visualisation library enforces its own structural contract. Supporting multiple libraries means handling:
Structural reshaping (row-based vs series-based vs hierarchical)
Aggregation or grouping logic specific to chart types
Consistent normalization so that transformations remain predictable
The transformation layer must therefore be reusable and decoupled from the rendering library’s internal expectations.
2. Extensibility and Maintainability
As new chart types or visualisation libraries are introduced, the system should extend without requiring modifications to existing transformation logic. Without a modular design, each addition risks breaking unrelated visualisations.
Extensibility is therefore not just desirable—it is essential for long-term maintainability.
3. Shared State Interactions
Charts rarely operate in isolation. They react to shared dashboard inputs such as filters, metrics, and time ranges. Without clear architectural boundaries, state changes can trigger cascading re-computations that are difficult to trace and debug.
A scalable solution must ensure that state orchestration does not leak into transformation logic.
4. Separation of Concerns
These challenges highlighted the need for a clear separation of responsibilities across layers. Mixing decision-making, data shaping, and rendering logic within a single class created tight coupling and reduced clarity about where specific responsibilities belonged.
A more layered approach was necessary to ensure each concern could evolve independently.
From Naive to Scalable: Direction of Evolution
These challenges made it clear that the existing structure could not scale. The architectural evolution looked like this:
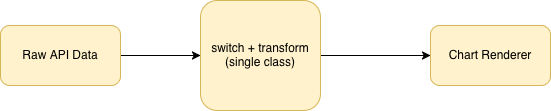
Naive Approach
In the naive approach, both decision-making and data shaping were embedded in a single class. This made the system rigid and prone to errors as new chart types were introduced.

The target direction separates responsibilities into distinct layers, allowing each concern to evolve independently while reducing coupling and technical debt.
Design Goals and Evaluation Criteria
Before settling on an architectural approach, we defined a set of guiding criteria:
Extensibility: Supporting a new chart type should not require changing existing transformations
Reusability: Common data shaping logic should be shareable across chart variants
Library Agnosticism: Switching or adding charting libraries should not affect core transformation logic
Testability: Data transformation steps should be independently unit-testable
Predictability: Shared dashboard state should not cause uncontrolled recomputations
These constraints ruled out monolithic conditional logic and pushed us toward a more modular, pattern-oriented architecture.
Architectural Direction (High-Level)
Based on these goals, we converged on three guiding ideas:
- A strategy-driven transformation layer to encapsulate chart-specific data shaping
- A factory-based resolution mechanism to select appropriate transformations dynamically
- An adapter layer to isolate charting library dependencies from core logic
This direction allows the system to support new chart types and libraries incrementally, without rewriting existing components.
In next post, we will see how we implemented right transformation logic for each chart type.

Ravindra Soman
Senior Full Stack Data Engineer
Ravindra is a Senior Full Stack Data Engineer specialising in frontend architecture and complex data visualisation systems. In his spare time, he likes to cook new dishes for his family, read fiction and travel the world.